Because I’m a cynical bastard, I regularly try to figure out what the real content of a published waveform is. For me, it’s usually someones EEG data that supposedly has some FFT peak that I can’t really believe. So instead of pouring over waveforms with Photoshop (read: Microsoft Paint) to figure out the data that’s in the an image, some time agoe ago I wrote a program in python to allow you to automatically get the numbers.
So I finally translated it to JavaScript, so all of you can benefit from it (and also I can use it at SfN).
I’ll only to a very brief code run through, because it’s pretty straightforward. The function get_file() is the start, in it the image the user selects is displayed on the screen and event listeners are created to pick up user clicks, finally three objects are created to store the details of the x and y scale bars, and the bounding box that the waveform should fit in. The two main callback functions down_canvas() and move_canvas() which are triggered when you mousedown of the canvas, and move on the canvas. When you mousedown, the callback checks which of the radio buttons you’ve checked, and then set appropriate start position properties of one of the three objects we just made. When you move, we set the end position properties, and redraw the canvas.
When you click the analyze button you trigger analyze(). First we check that you’ve set everything, then we convert your image to greyscale by averaging the RGB values, and threshold the data to exclude very light pixels. Then I go columnwise across the image. I perform a simple “center of mass” equation, such that the line position P, as is transits through a column of pixels, n pixels long, which each pixel having intensity m and position p is:
That is to say, you sum the position multiplied by the intensity, and divide it by the sum of the intensities.
The result is pretty good. Here is an overlay of some original data, and the output of the tracing algorithm.
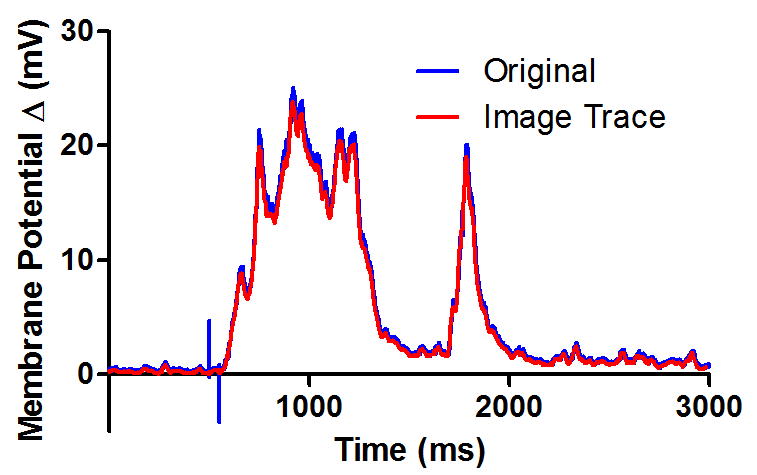
The error coming mainly from how you draw the scale bars. You can try it yourself. The data came from this image and you can have a go at the script here. It’s simple enough to use: #1 Select a local file. #2 Draw a line the same length as the X axis scale bar, and type in how many data units it represents. #3 Do the same for the Y axis scale bar. #4 Draw a box surrounding the waveform, but not your X and Y axis lines (or anything else). #5 Press analyze and the data is spit out into the textbox.