The situation is common. Let’s say you want to know if a drug increases sleep duration. You grab 20 mice, you give 10 of them the drug, and 10 of them vehicle. You measure their sleep durations and you do a t-test, and get p < 0.05. You conclude that the drug increases sleep time. Then you realize you did the experiment on all male mice, so you grab a cohort of 20 female mice, give 10 the drug and 10 placebo. You measure how long they sleep and you do a t-test and get p > 0.05. You conclude that the drug does not increase sleep time in female mice. Thus, you conclude that the drug has different effects in males and females.
Seems reasonable right? Well it’s not reasonable. In fact, it’s even less reasonable than I thought.
If you believe the approach above is reasonable, I think If I show you a graph that could be generated in the above situation you’ll start to see the problem
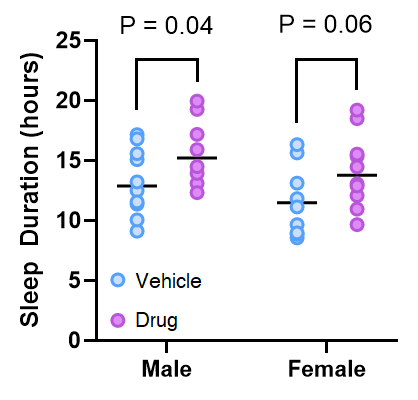
One way to frame the logical flaw lies that underpins this problem is that it is a mistake to conclude that if p > 0.05, then that means the drug has had no effect. When p = 0.06, it means that if the null hypothesis was true, we would get a t value as, or more, extreme in 6/100 trials. This is not the same thing as saying there is no effect of the drug. Another way to think about it is that we can’t conclude anything about the difference in the effect of the drug in males and females, because we never actually compared it.
Perhaps you say “You’ve picked some specific case where the ‘two t-test’ approach doesn’t work, and okay, I get that some anally retentive statistician may have a problem with this approach, but it can’t be that bad’. Well it is. At worst, this approach will give you a false answer 50% of the time! Let me show you.
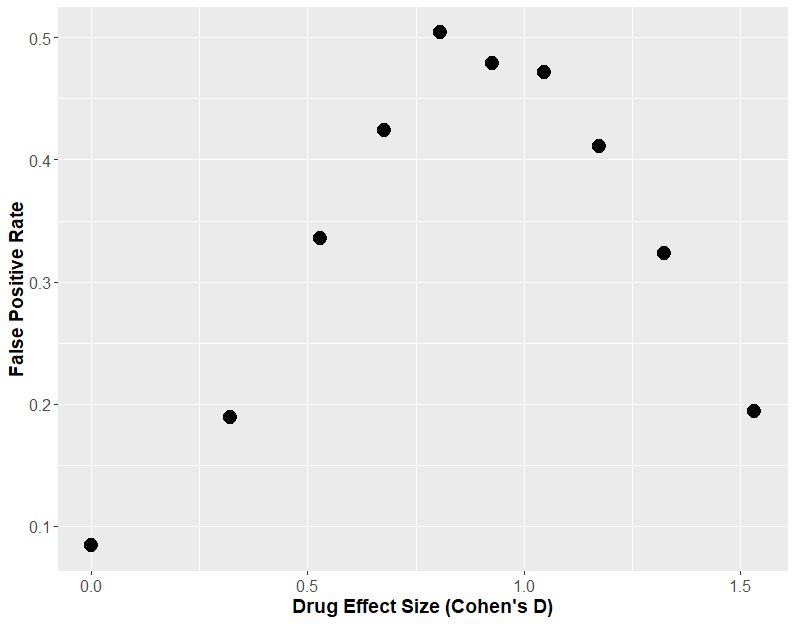
If we generate data just like the above, where there is no true effect of sex, and we keep everything constant, apart from an increasing effect of our “drug”, we can look to see how often sex appears to have a statistically significant effect (i.e. the two t-tests give different results, one significant, one insignificant). How frequently this happens could be called the “false positive rate”. When we do that, we see that at a maximum, 50% of the time the two t-test approach tells us sex has an effect when there was none.
If we plot that same graph, but instead of using the effect size, we plot the theoretical power of the statistical test (i.e. how often the each t-test would find an effect of drug), we will understand why this “two t-test” approach is so fraught.
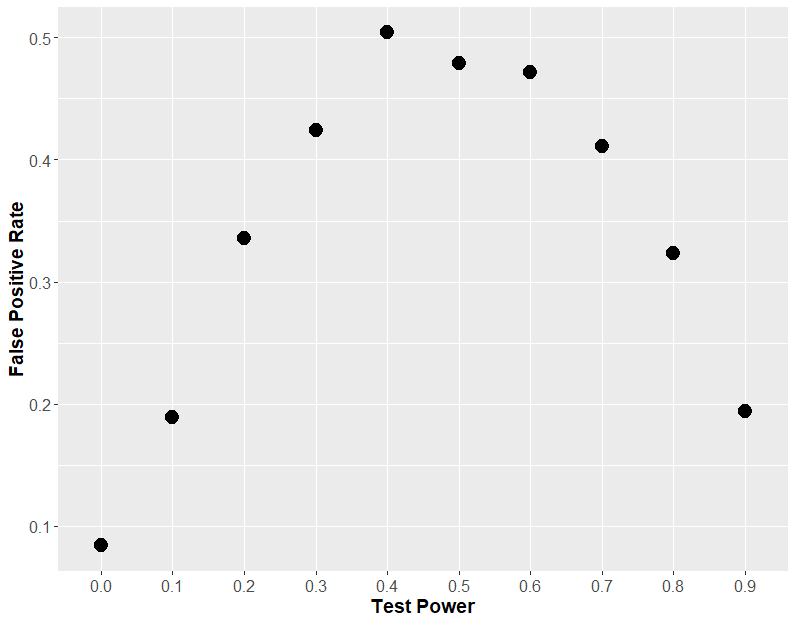
You see, it comes down to statistical power. If each t-test has very low power, then both t-tests will always be insignificant, so you will never see an effect of sex. If each t-test has a very high power, then both t-tests will always be significant, and so again, you will never see an effect of sex. But in the middle, when the t-test has about 50% power, then 50% of t-tests will be significant, which means that on average, in 50% of the cases, one test will be positive and one will be negative, leading you to erroneously conclude that sex has an effect.
So what should you do instead? You should run a 2-way ANOVA. A 2-way ANOVA allows you to investigate if there is an effect of drug, if there is an effect of sex and importantly, if there is an interaction of these two factors, i.e. that the effect of drug depends on sex. If we do that, our problems go away.
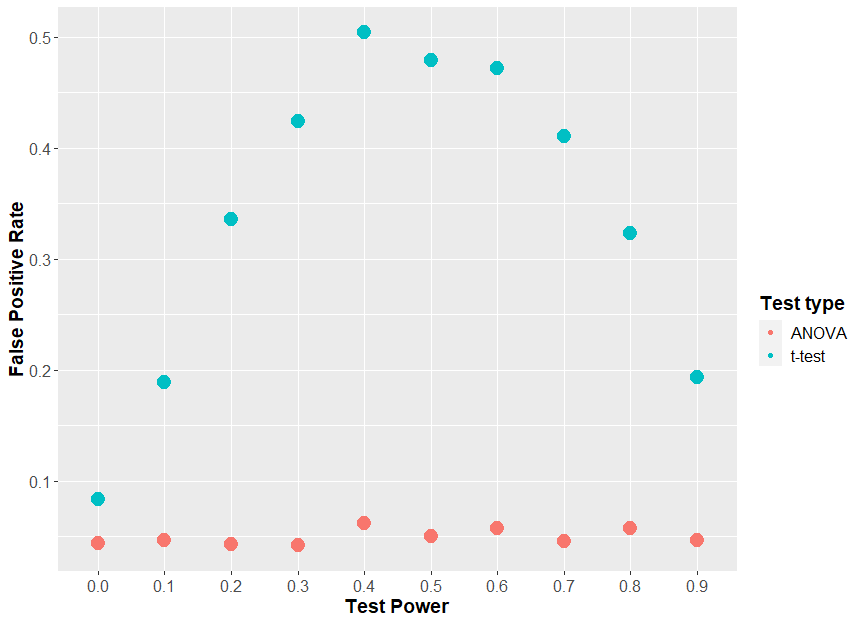
But maybe you think “Well maybe this using a 2-way ANOVA stops us making false positives, but it ruins out ability to detect if sex has an effect at all? Not really. If we change the effect size of drug, and the effect size of sex, and see how often the test can detect if sex has an effect of drug, we get some very curious results.
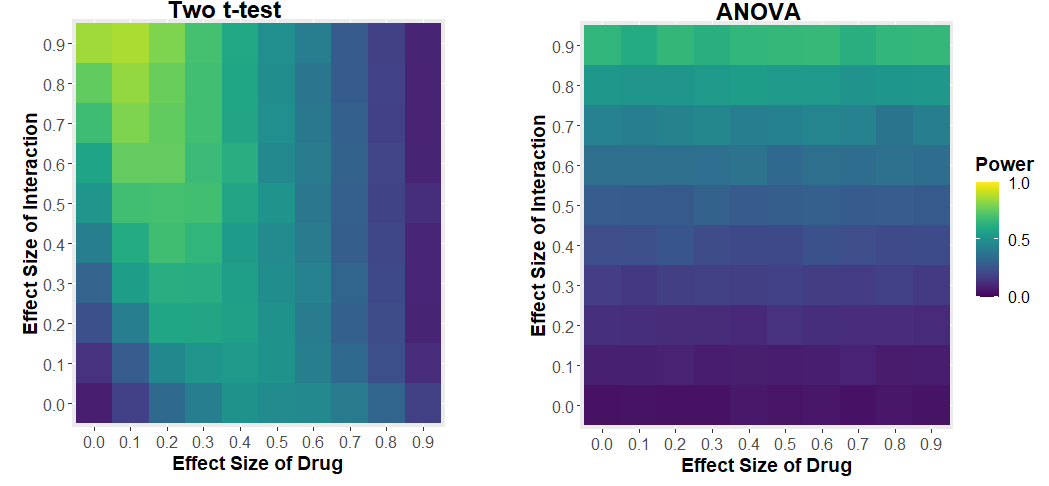
We see that the power of the two t-test approach to detect the interaction depends on the effect size of the drug. If the drug has a large effect, it drowns out the effect of the interaction. The two-way ANOVA approach has much more sensible behaviour: your ability to detect the interaction only depends on the size of the interaction.
Hopefully you understand that this is not specific to the effect of drugs and sex. If you perform 2 t-tests looking at some intervention in two different situations, and one is significant, and one isn’t, you cannot conclude that the intervention has a different effect in those two situations. You need to perform some test that actually compares the effect of the intervention in the two cases, most notably, a two way ANOVA.
Finally, I want to say that I am not the first one to point this out. There have been warnings published about this before, like in “The Difference Between “Significant” and “Not Significant” is not Itself Statistically Significant” By Gelman and Stern, and “Erroneous analyses of interactions in neuroscience” by Nieuwenhuis et al.