I’ve already made a rudimentary script for extracting data from published waveforms and other line graphs. But what I’ve needed recently is to be able to extract data from XY scatter graphs. This is a slightly more complex problem because it requires feature detection of an unknown number of points. You can access the script here, and I’ll go over its use and some of the code in the rest of this post.
Ultimately, this script turned out to be quite long, but the meat of it is basically one function: floodfill. We start with empty array (blobArray) that will hold arrays containing the pixels information of each data point. We then iterate over every pixel. If the pixel colour matches the colour the user clicked on, and isn’t already in the blobArray, then we “flood fill” that shape to define the blob, and that data is returned into the blobArray. The psuedocode looks like this:
blobArray = []
targetColor = color at click
for every pixel within bounding box
    if pixel color == targetColor
        if pixel not in blobArray
              blobArray.push(floodfill(pixel, targetColor))
The floodfill function is non-recursive, and instead involves a stack of possible start locations to fill from. While the stack is non empty, the functions moves up the screen, waiting until it goes out of the zone that matches the targetcolor, then it moves down the screen adding pixels to the blob array. As it’s going that, any time it notices to that in the last step, that the left or right pixels have gone from non-matching, to matching, it adds that pixel location to the starting point stack. The psudocode looks like this:
function floodfill(pixel, targetColor)
    blob = []
    startingPositionStack = [pixel];
    while startingPositionStack is not empty
        pixelStart = startingPositionStack.pop()
        while color at pixelStart == targetColor
            move pixelStart one pixel up
        while color at pixelStart == targetColor
            if pixelStart not in blob
                blob.push(pixelStart)
            if pixel to left changed from nonmatching to matching over last step
                startingPositiongStack.push(pixel to the left of pixelStart)
            if pixel to right change from nonmatching to matching over last step
                startingPositiongStack.push(pixel to the right of pixelStart)
            move pixelStart one pixel down
    return blob
In all honesty, I almost verbatim stole this code from William Malone, who explains how it works beautifully here. I also need to thank Minh-Son To, who helped me with some code when I was being moronic.
Using the script is straightforward, you go through steps 1 to 5, first drawing over the X and Y axis, and stating where they started and where they ended. You then draw a bounding box over the area of the figure you want to extra data from. Finally you click on a data point. The script will only pick out data points that match the colour of the one you click on. There are some important caveats. Firstly, if there are two data points overlapping, they will be counted as one. Secondly, if the data points are bisected by a non matching colour, for example a line of best fit, they will probably be counted as two data points. However, given that, if used on appropriate graphs, the results are pretty good.
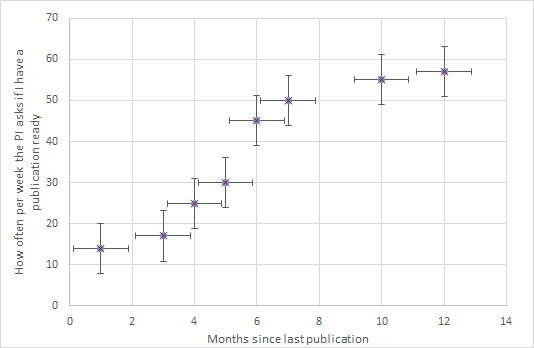
The blue colour is the point of the original data, and the red crosses show where the algorithm thought the dots were. Most of the error comes from inability to draw the axis accurately. For references sake, the worst X value was out by 0.8%, and the worst Y value was out by 1.2%.