Suite2p is a wonderful Matlab toolbox written by Marius Pachitariu for analyzing population calcium imaging data. It uses a number of computational tricks to automate and accelerate the process (so no more drawing regions of interest (ROIs) by hand!). However, I spend most of my time imaging dendrites and axons, and here suite2p has a problem. Suite2p uses a heuristic that is looking for approximately elliptical ROIs, and hence it tends to split axons/dendrites into a large number smaller ROIs. The problem was simple: how can we merge the ROIs belonging to single cells? Well I used the logic that ROIs that belong to the same neuron should have highly correlated calcium signals (yes, I can imagine a situations where this wont be the case in dendrites, but bAPs will still dominate the calcium trace 99.9% of the time). Hence I simply correlate each ROI with every other ROI. ROIs with a correlation coefficient above some user settable threshold are considered to be part of the same process.
The main script is available here, and it requires distinguishable_colors.m (which in turn requires the image processing toolbox I believe).
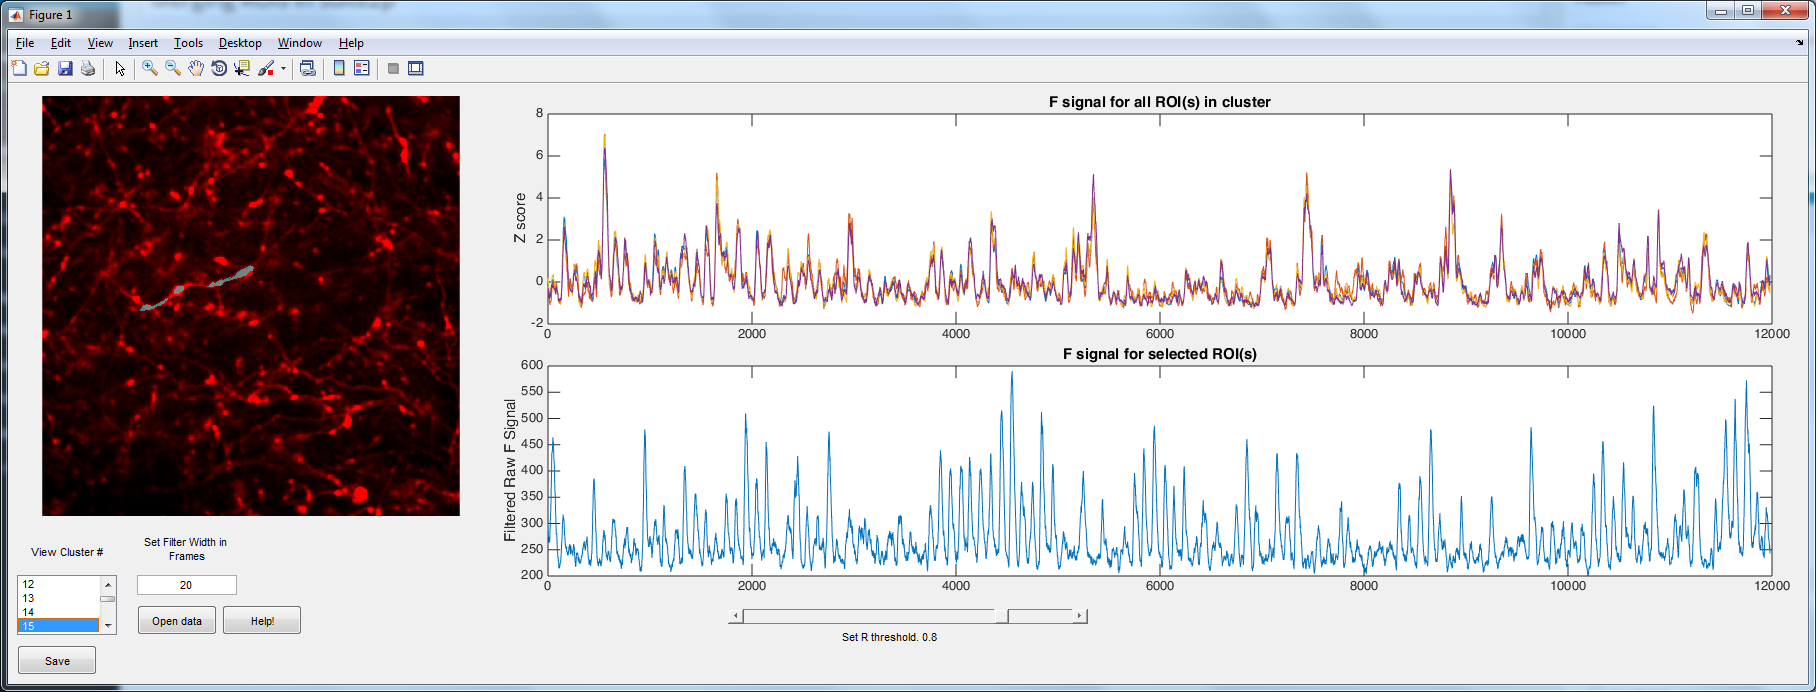
The code is relatively well documented/commented, and there is even a ‘Help!’ button. If anyone has any problems with it, please let me know.