Don’t be afraid of parallel programming in Python

When it comes to writing code, I have always been a believer of the rules of optimization, which state:

The first rule of optimization is: Don’t do it.

The second rule of optimization (for experts only) is: Don’t do it yet.

These rules exist because, in general, if you try to rewrite your code to get a speed up, you will probably waste a lot of time and end up with code that is unreadable, fragile and that only runs a few milliseconds faster. This is especially true in scientific computing, where we are writing in high level languages, which use highly optimized libraries to perform computationally intensive tasks.

However, there are times when those rules of optimization can be broken. And there is a super simple way of leveraging parallel programming in Python that can give you a >10x speed up.

Continue reading

The difference between two t-tests doesn’t tell you what you think.

The situation is common. Let’s say you want to know if a drug increases sleep duration. You grab 20 mice, you give 10 of them the drug, and 10 of them vehicle. You measure their sleep durations and you do a t-test, and get p < 0.05. You conclude that the drug increases sleep time. Then you realize you did the experiment on all male mice, so you grab a cohort of 20 female mice, give 10 the drug and 10 placebo. You measure how long they sleep and you do a t-test and get p > 0.05. You conclude that the drug does not increase sleep time in female mice. Thus, you conclude that the drug has different effects in males and females.

Seems reasonable right? Well it’s not reasonable. In fact, it’s even less reasonable than I thought.

Continue reading

Principal Component Analysis (PCA) For Dummies

PCA is one of the first tools you’ll put in your data science tool box. Typically, you’ve collected so much data, that you don’t even know where to begin, so you perform PCA to reduce the data down to two dimensions, and then you can plot it, and look for structure. There are plenty of other reasons to perform PCA, but that’s a common one.

However, when you ask how PCA works, you either get a simple graphical explanation, or long webpages that boil down to the statement “The PCAs of your data are the eigenvectors of your data’s covariance matrix”. If you understood what that meant, you wouldn’t be looking up how PCA works! I want to try to provide a gateway between the graphical intuition and that statement about covariance and eigenvectors. Hopefully this will give you 1) a deeper understanding of linear algebra, 2) a nice intuition about what the covariance matrix is, and of course, 3) help you understand how PCA works.

Continue reading

How to correct for series resistance (and whole cell capacitance) in real cells

I’ve talked before about the problems series resistance [i.e. the resistance formed by the tip of your electrode and the gunk in it] poses when you’re performing whole-cell voltage clamp recordings. Simply put, it limits your ability to hold the cell at the voltages you want to, because every time you pass current, some voltage forms over the series resistance and you’re amplifier can’t tell the difference between the voltage over the membrane and the voltage over your series resistor. It also limits your temporal accuracy, as it helps to set up up a low pass filter for your command potential. Thankfully, because the problem is essentially inescapable during whole-cell voltage clamp, essentially all voltage clamp amplifiers come with series resistance compensation: an electronic procedure where the amplifier estimates how much of a problem your series resistance will be, and works to minimize it. However, in order for that circuitry to work, your amplifier needs to know the whole-cell capacitance of the cell you’re recording from (Cm) and how much series resistance (Rs) you’re up against. Typically your set these values while looking at the current response to a test pulse. However, outside of a few select examples, this process of telling the amplifier what Cm and Rs is (know as “correcting for whole-cell parameters” or “capacitance compensation”) isn’t actually trivial. Let’s have a look at why this is, and how we should be doing it in real cells

Continue reading

How bad is my distribution really?

Most scientists think that t-tests, ANOVAs, linear regression etc rely on your data being normally distributed. Is that really true? And given that no data is perfectly normal, how normal does your data have to be? Can I see what effect non-normality will have on my hypothesis testing? I’m going to use some simply tricks that us to see how bad our distribution is.
Continue reading

Nonnegative Matrix Factorization for Dummies.

It seems like every paper I look at these days has Nonnegative Matrix Factorization (NMF) in its methods somewhere. From machine learning, to calcium imaging, the seemingly magic ability of NMF to pull apart signals gets a lot of use. In this post I want to explain NMF to people who have zero understanding of linear algebra, show a few applications, and maybe give you some inspiration of how to use NMF in your own work.
Continue reading

Filtering – A practical guide

Finding good information on how filters work, what the different types of filters mean, and how you should filter your data is hard. Lots of explanations only make sense if you have a year or two of electrical engineering education, and most of the rest are just a list of rules of thumb. I want to try to get you to a place where you can test your own filter settings, and show you the importance of the rules of thumb without going into the relatively complex math that is often used to explain filters. Warning: a lot of the code I’m going to use requires the Matlab Signal Processing Toolbox. If you don’t have it, you wont be able to execute the code yourself, but hopefully you’ll still be able to follow along with the logic.
Continue reading

Electrical Stimulation: Why we use isolators.

Even though we are now in the era of optogenetics, electrical stimulation of excitable tissues is still common place in the lab. However, despite how common they are, I see that a lot of people don’t fully understand why they using some fancy expensive box to deliver the stimulus, rather than just, say, using the DAC output of your digitizer. The actual physics of why passing current through your tissue excites neurons/muscles is a bit more complex than you might think, but that’s not what I’m going to talk about. I’m going to talk about what a stimulus isolator is, and why we use them. Continue reading

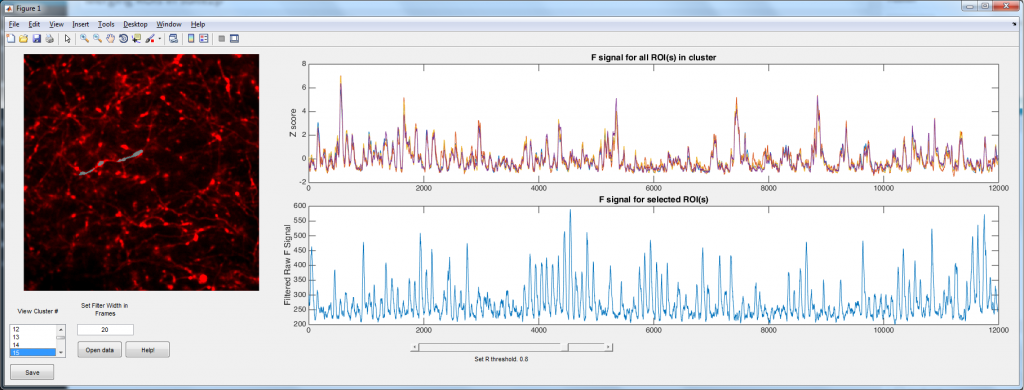
Merging ROIs in suite2p

Suite2p is a wonderful Matlab toolbox written by Marius Pachitariu for analyzing population calcium imaging data. It uses a number of computational tricks to automate and accelerate the process (so no more drawing regions of interest (ROIs) by hand!). However, I spend most of my time imaging dendrites and axons, and here suite2p has a problem. Suite2p uses a heuristic that is looking for approximately elliptical ROIs, and hence it tends to split axons/dendrites into a large number smaller ROIs. The problem was simple: how can we merge the ROIs belonging to single cells? Well I used the logic that ROIs that belong to the same neuron should have highly correlated calcium signals (yes, I can imagine a situations where this wont be the case in dendrites, but bAPs will still dominate the calcium trace 99.9% of the time). Hence I simply correlate each ROI with every other ROI. ROIs with a correlation coefficient above some user settable threshold are considered to be part of the same process.

The main script is available here, and it requires distinguishable_colors.m (which in turn requires the image processing toolbox I believe).

join_axon

The code is relatively well documented/commented, and there is even a ‘Help!’ button. If anyone has any problems with it, please let me know.